Indigenous Procurement Policy (IPP) changes
In February 2025, the Australian Government announced changes to the IPP to increase the ambition of the policy and ensure that the economic benefits of the IPP are genuinely flowing to First Nations people as intended. An updated version of the IPP was released in May 2026.
IPP Overview
The primary purpose of the Indigenous Procurement Policy is to stimulate Indigenous entrepreneurship, business and economic development, providing First Nations people with more opportunities to participate in the economy.
Prior to the implementation of the policy, Indigenous enterprises secured limited business from Commonwealth procurement. The policy is intended to significantly increase the rate of purchasing from Indigenous enterprises.
How the IPP works:
- Annual targets for the volume and value of contracts to be awarded to Indigenous businesses by the Commonwealth and each Portfolio.
- The Mandatory Set Aside (MSA) requires that Indigenous businesses be given an opportunity to demonstrate value for money before a general approach to market. The MSA applies to procurements to be delivered in remote Australia and for all other procurements wholly delivered in Australia valued between $80,000 and $200,000 (GST inclusive).
- Indigenous employment and business participation targets apply to contracts wholly delivered in Australia valued at $7.5 million or more in 19 industries, known as Mandatory Minimum Indigenous Participation Requirements (MMR).
Exemption 16 of the Commonwealth Procurement Rules allows portfolios to procure directly with Indigenous small to medium size enterprises (SMEs), provided the enterprise can demonstrate value for money.
The success of the IPP is measured by:
- An increase in the number of Indigenous businesses awarded a contract
- An increase in the volume and value of contracts awarded to Indigenous businesses.
Since 2015 and as at February 2026, the IPP has performed well against these KPIs, generating over $13.5 billion in contracting opportunities for Indigenous businesses. This has involved over 86,000 contracts awarded to more than 4,700 Indigenous businesses. Detailed data for 2024-25 Commonwealth Indigenous procurement outcomes is available at:
IPP Guides and Factsheets
Factsheets for general IPP use:
- Factsheet: Overview
- Factsheet: Mandatory Minimum Indigenous Participation Requirements
- Factsheet: Mandatory Set Aside
Guides for managing MMRs
Guides for general IPP use
IPP Data/results
2024-25 Commonwealth Indigenous procurement outcomes
Over 1,200 Indigenous businesses secured 13,144 new contracts during the 2024-25 financial year. As of September 2025, these contracts were valued in total $1.6 billion.
The Commonwealth and all portfolios exceeded their 2024-25 number of contracts targets of 3%. The Commonwealth and all portfolios exceeded their 2024-25 value of contract targets of 2.25% awarded to Indigenous businesses.
The method for calculating and measuring performance against the targets is outlined in the IPP policy document. The following data is current as at September 2025.
Portfolio | Number Target | Contract count against target | Value Target | Value of contracts |
|---|---|---|---|---|
| Agriculture, Fisheries and Forestry | 57 | 229 | $12,425,061 | $20,409,882 |
| Attorney-General's | 106 | 505 | $13,336,201 | $47,129,211 |
| Climate Change, Energy, the Environment and Water | 106 | 410 | $21,362,322 | $45,372,292 |
| Defence | 760 | 6,230 | $320,107,884 | $1,022,037,698 |
| Education | 19 | 72 | $3,235,900 | $4,173,961 |
| Employment and Workplace Relations | 63 | 785 | $49,753,032 | $56,437,120 |
| Finance | 58 | 303 | $11,645,119 | $18,166,860 |
| Foreign Affairs and Trade | 80 | 369 | $9,933,920 | $20,544,130 |
| Health and Aged Care | 134 | 412 | $49,426,904 | $53,499,752 |
| Home Affairs | 48 | 3,299 | $21,514,521 | $23,654,109 |
| Industry, Science and Resources | 76 | 531 | $14,281,700 | $53,163,183 |
| Infrastructure, Transport, Regional Development, Communications and the Arts | 51 | 411 | $8,139,567 | $17,238,476 |
| Parliamentary Departments | 14 | 37 | $2,285,864 | $3,046,026 |
| Prime Minister and Cabinet | 27 | 619 | $4,175,057 | $53,676,602 |
| Social Services | 84 | 893 | $15,725,538 | $108,676,625 |
| Treasury | 123 | 497 | $30,565,905 | $59,256,950 |
| Veterans' Affairs | 60 | 74 | $5,324,184 | $8,028,412 |
| Total Commonwealth | 1,866 | 15,676 | $593,238,679 | $1,614,511,290 |
- For details of how portfolios report contracts against targets refer to the Indigenous Procurement Policy.
- The IPP policy includes multiyear contracts in calculating performance against number targets.
IPP data will change as contracts are varied or published on AusTender and will likely vary from Indigenous procurements published by individual portfolios.
2025-26 Commonwealth Indigenous Procurement Targets (number and value of contracts by portfolio)
Portfolio | 2025-26 procurement Number target (3% of number of eligible contracts*) | 2025-26 procurement Value target (3% of value of eligible contracts*) |
|---|---|---|
| Agriculture, Fisheries and Forestry | 83 | $16,823,194 |
| Attorney-General's | 46 | $7,748,713 |
| Climate Change, Energy, the Environment and Water | 153 | $30,782,318 |
| Defence | 754 | $424,326,457 |
| Education | 27 | $4,405,377 |
| Employment and Workplace Relations | 92 | $39,546,961 |
| Finance | 114 | $44,745,352 |
| Foreign Affairs and Trade | 92 | $10,072,054 |
| Health, Disability and Ageing | 131 | $70,267,811 |
| Home Affairs | 99 | $33,215,703 |
| Industry, Science and Resources | 68 | $16,939,344 |
| Infrastructure, Transport, Regional Development, Communications, Sport and the Arts | 57 | $10,967,252 |
| Parliamentary Departments (not a portfolio) | 14 | $3,718,636 |
| Prime Minister and Cabinet | 40 | $7,352,701 |
| Social Services | 15 | $738,159 |
| Treasury | 115 | $40,663,601 |
| Veterans' Affairs (part of the Defence Portfolio) | 54 | $8,523,418 |
| Total Commonwealth | 1,952 | $770,837,051 |
* For details on how targets are calculated targets refer to the Indigenous Procurement Policy.
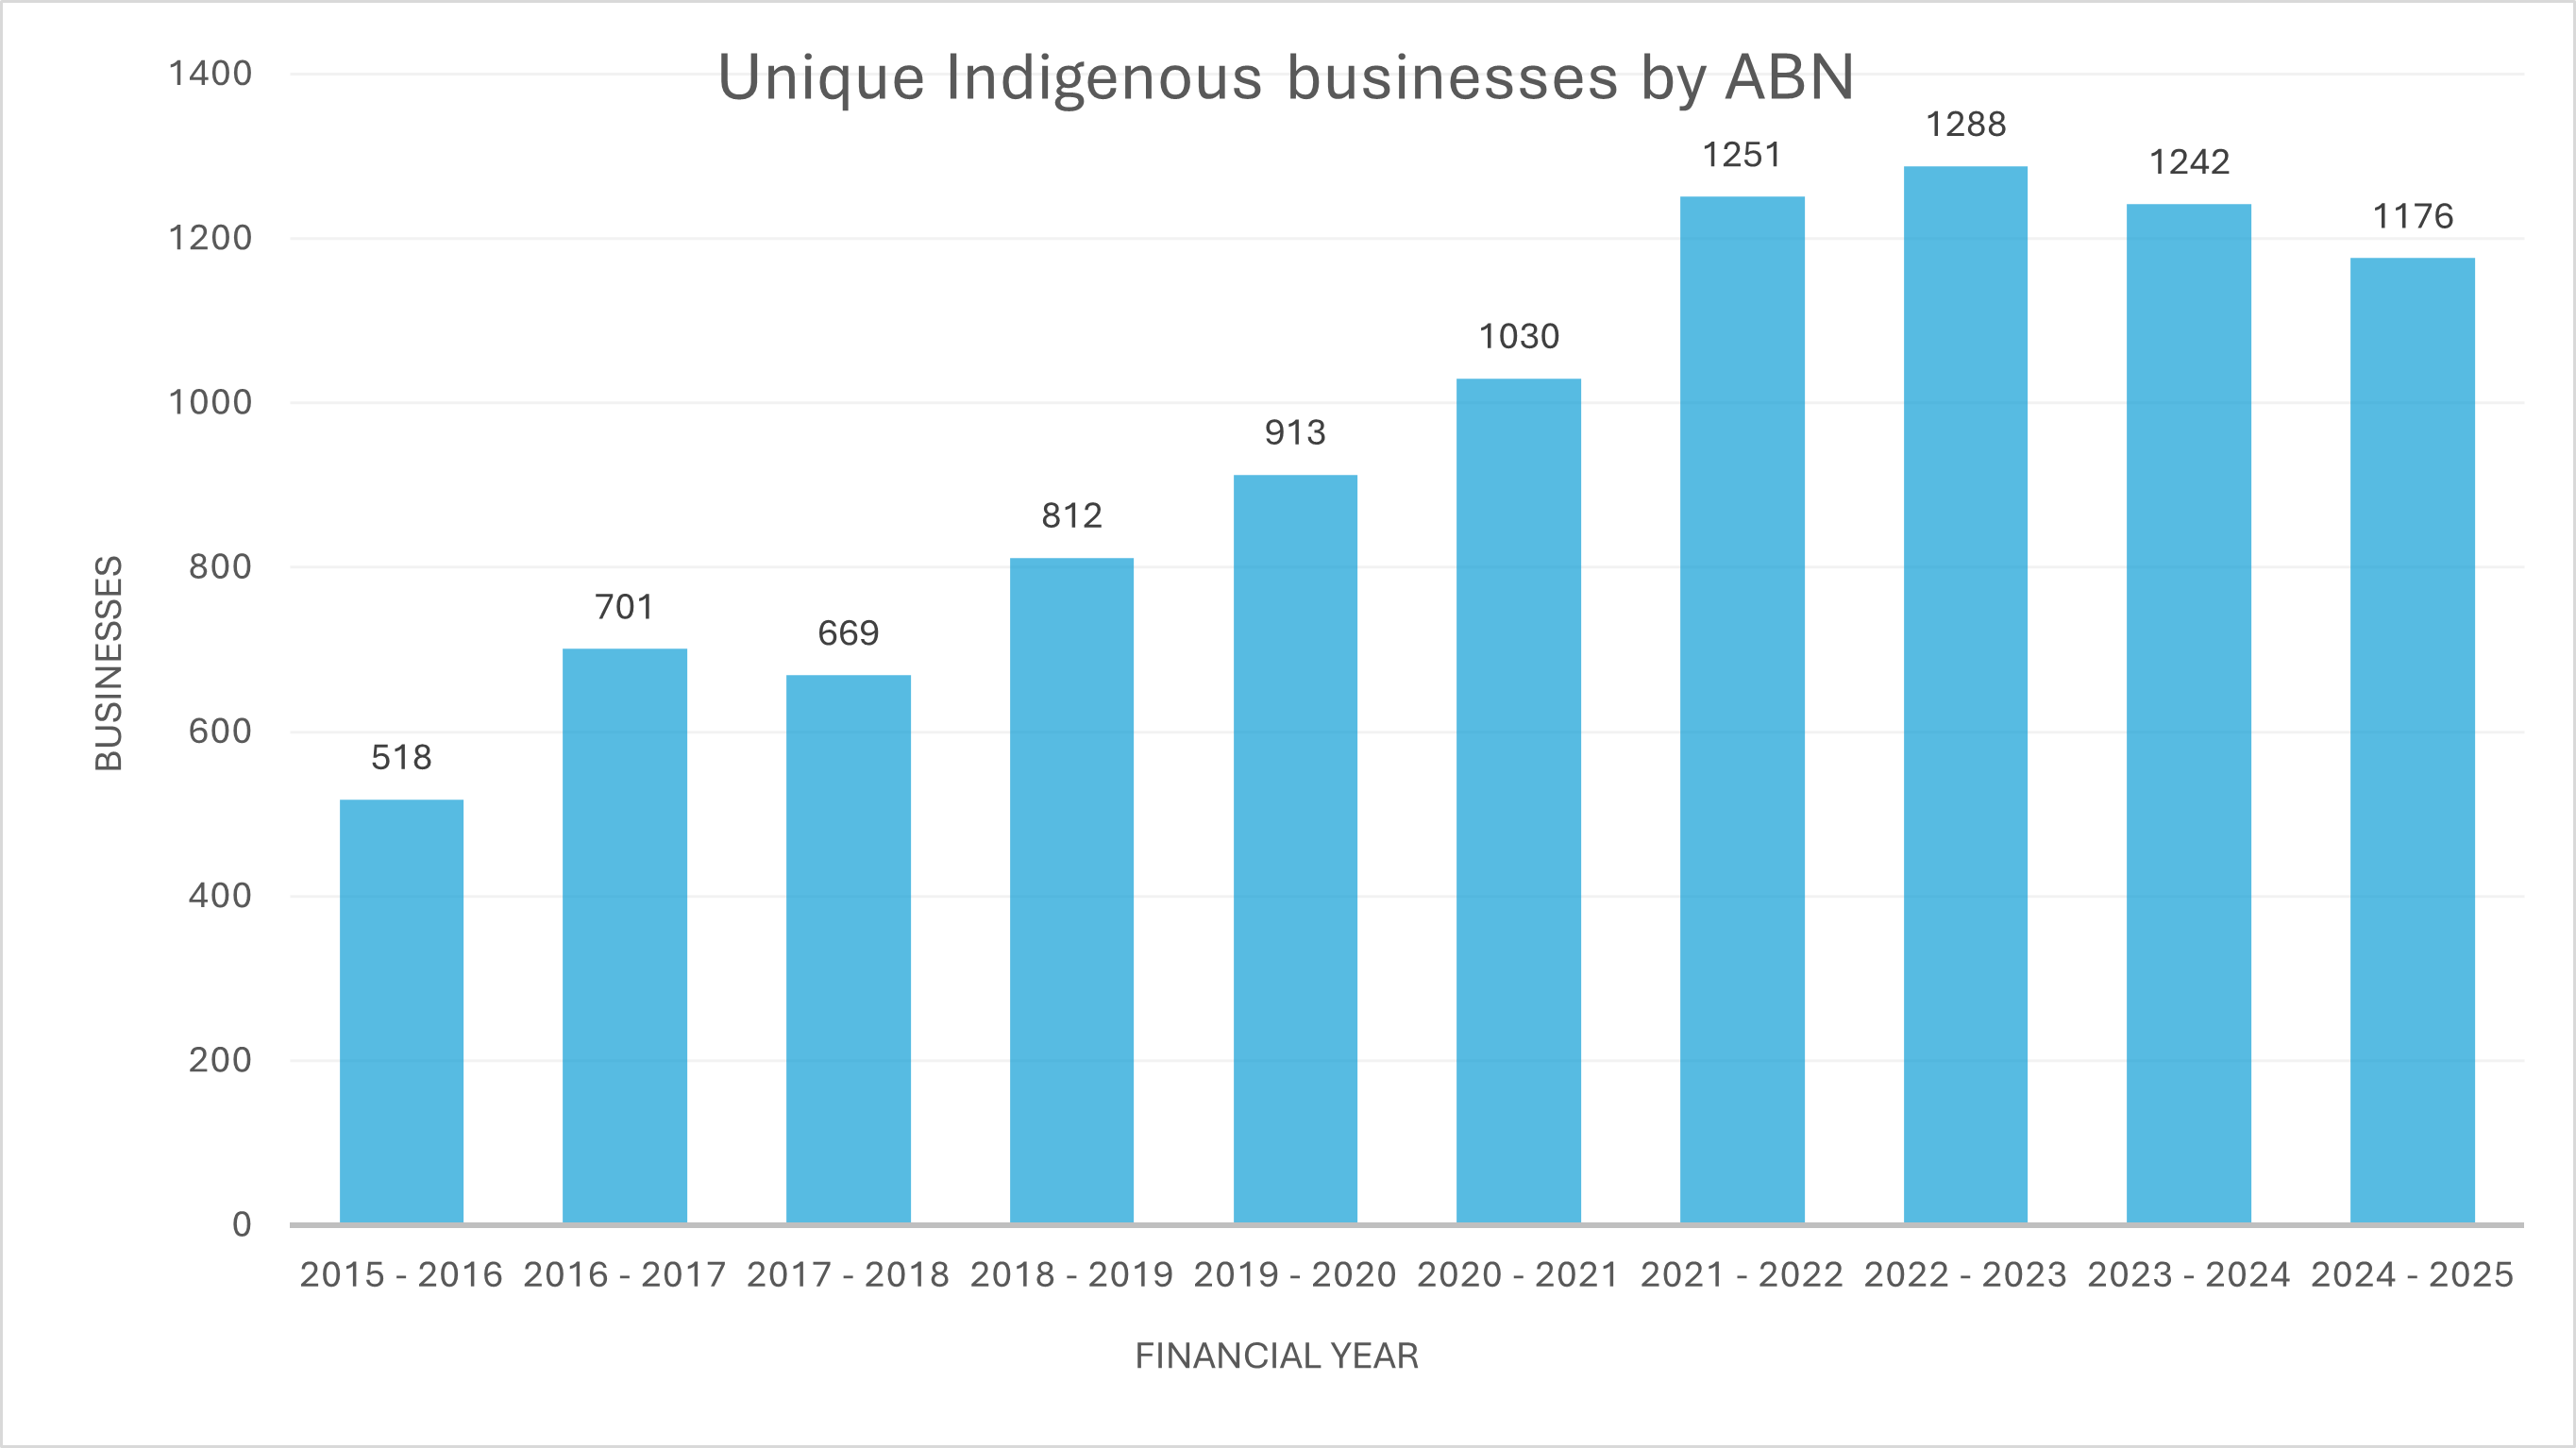
Number of Businesses by Financial Year
The following graph shows the number of unique Indigenous businesses within the Commonwealth supply chain each financial year since the IPP commenced.
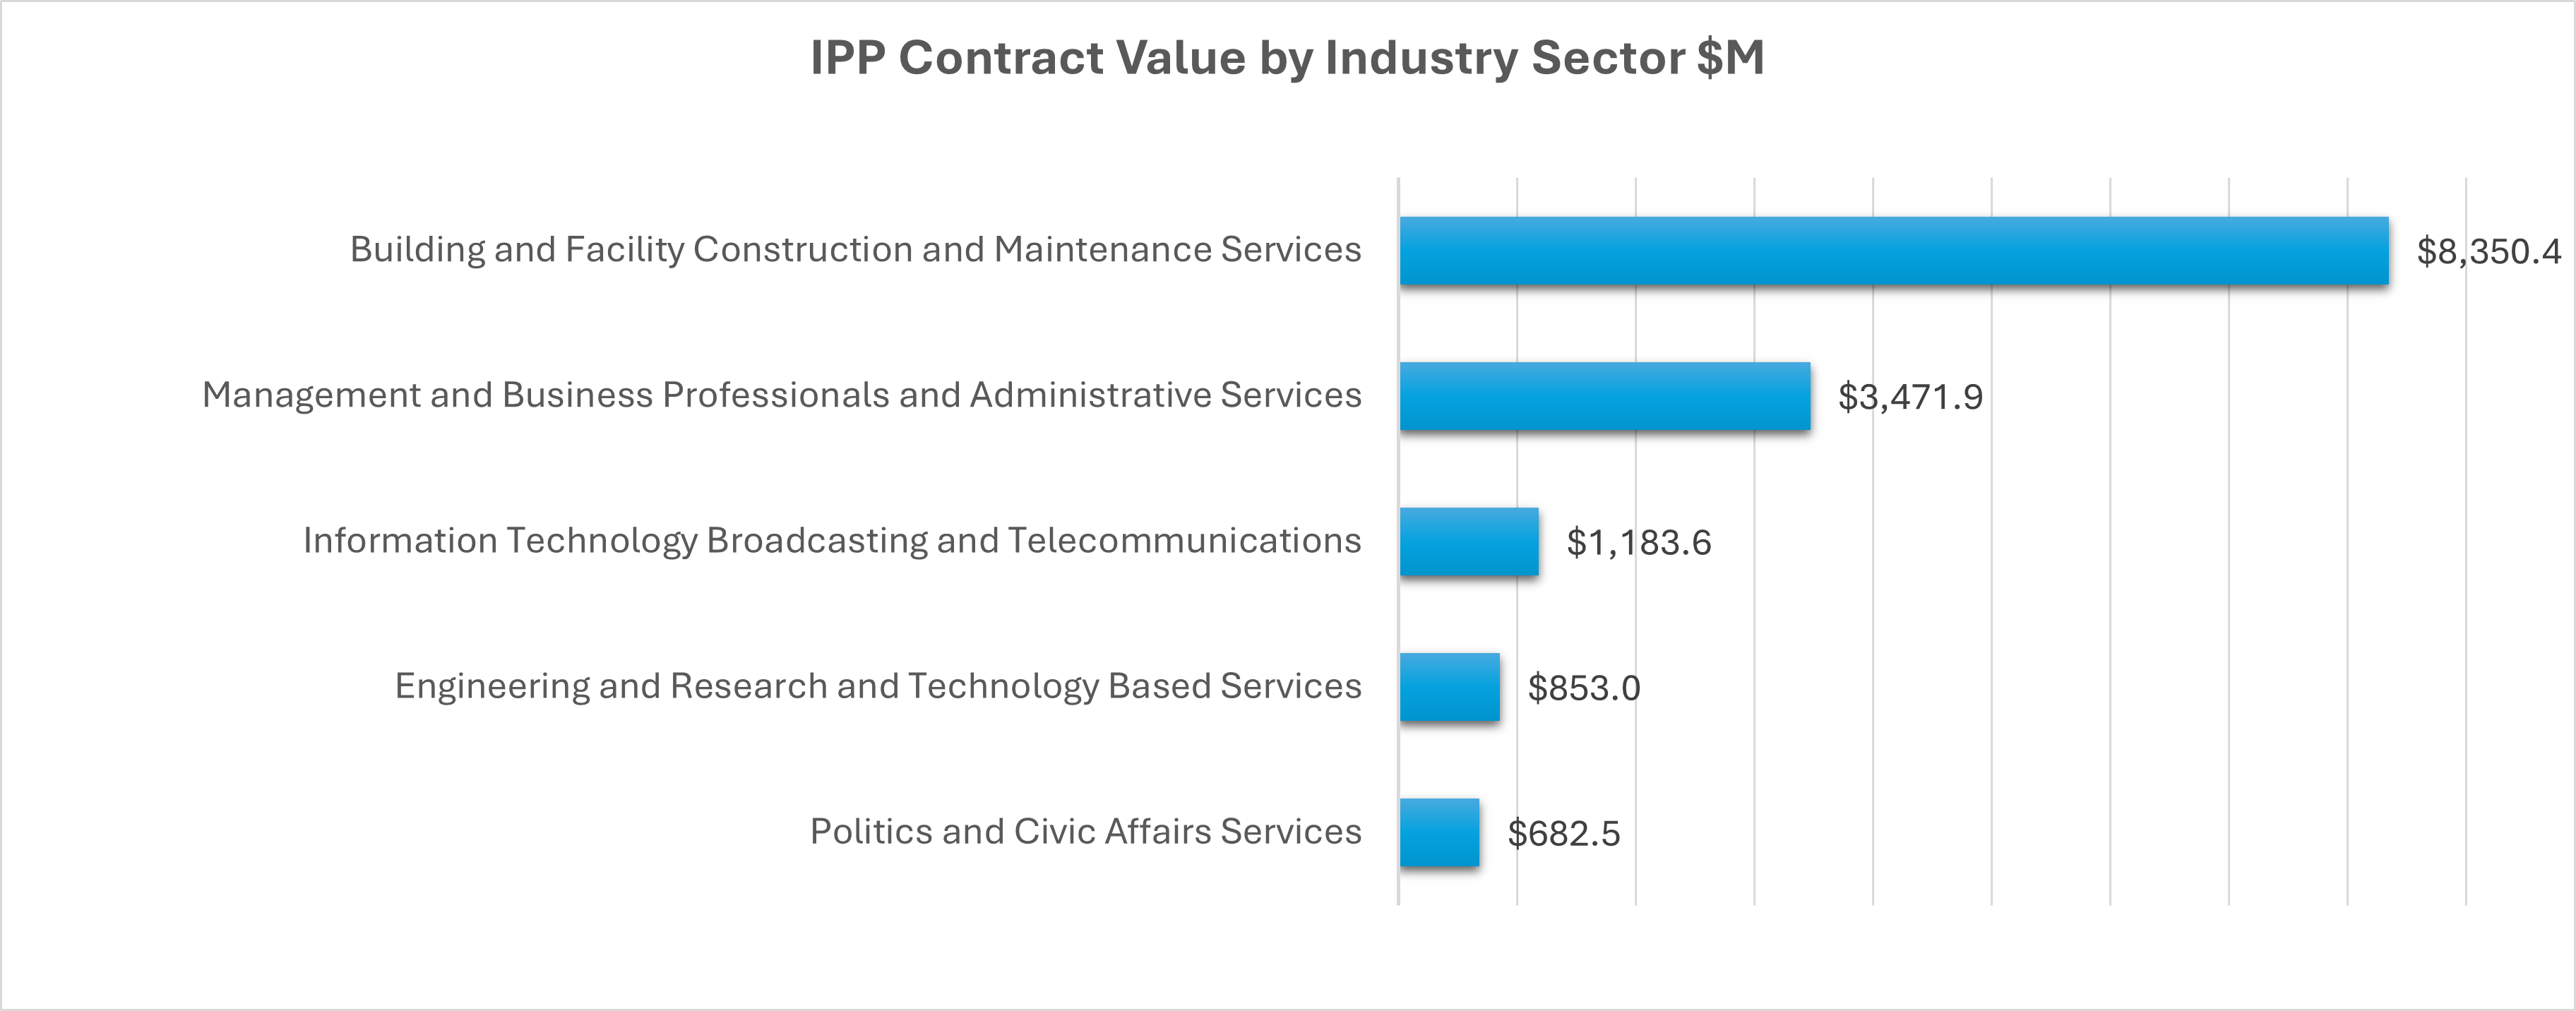
Top 5 Industry Categories
The following graph shows the top 5 industry categories by value for the 2024-25 financial year.
MSA outcomes
MSA arrangements provide Indigenous SMEs with the opportunity to demonstrate value for money before the procuring official makes a general approach to the market.
The following tables demonstrate Indigenous businesses continue to win contracts under the MSA, including in remote areas.
MSA Results | 2019-20 | 2020-21 | 2021-22 | 2022-23 | 2023-24 | 2024-25 |
|---|---|---|---|---|---|---|
| Number of new IPP contracts valued at $80,000–$200,000 and listed on AusTender | 493 | 649 | 806 | 469 | 321 | 298 |
| Number of new IPP contracts, valued between $80,000–$200,000, as percentage of total listed on AusTender | 4.42% | 5.63% | 6.52% | 4.85% | 3.61% | 3.49% |
| Value of new IPP contracts valued at $80,000–$200,000 and listed on AusTender ($ million) | $66.0 | $85.8 | $108.5 | $62.5 | $41.8 | $39.8 |
| Value of new IPP contracts valued between $80,000–$200,000, as percentage of total value of these contracts listed on AusTender | 4.51% | 5.66% | 6.62% | 4.93% | 3.59% | 3.60% |
| MSA – Remote Performance | 2019-20 | 2020-21 | 2021-22 | 2022-23 | 2023-24 | 2024-25 |
|---|---|---|---|---|---|---|
| Number of new contracts delivered in remote areas | 1,126 | 1,520 | 2,278 | 2,414 | 2,121 | 1,940 |
| Value of new contracts delivered in remote areas ($ million) | $118.7 | $83.3 | $207.1 | $99.5 | $57.6 | $76.8 |
MSA notes:
- For full details on the MSA including information on when it does not apply refer to the Indigenous Procurement Policy.
- Under the IPP, the MSA applies to all contracts delivered in remote areas regardless of value. As a result, contracts delivered in remote areas, that also meet the MSA threshold ($80,000-$200,000), are included in both MSA tables on this page.
- IPP data for remote Australia is under-reported as it relies on manual reporting. NIAA continues to work with portfolios to develop better systems to collect this data.
- A Remote Indigenous Procurement Policy (RIPP) map under the IPP is available with more information about the RIPP regions.
MMR outcomes
Since 1 July 2016 and as of February 2026, 1,076 contracts valued at $88.4 billion, awarded to 525 organisations, have been subject to MMRs.
MMR targets apply to contracts wholly delivered in Australia valued at or above $7.5 million that are awarded in one or more of 19 specified industry categories.
For full details on the 19 specified industry categories please refer to the Indigenous Procurement Policy. Some sub-industry category exemptions also apply.
Companies with active MMR contracts
Refer to the contracts with an MMR, as at 25 February 2026 for the complete list of organisations that have a current contract.
Latest News